

Key points
- Demand for ambulance services remains high in March, with an increase in both category 1 and category 2 incidents.
- Despite continued high demand, ambulance services delivered strong performance this month. For category 2 response times, the national 30-minute target was met - for the third time in nearly four years. While category 1 average response times were the fastest recorded since May 2021.
Incidents
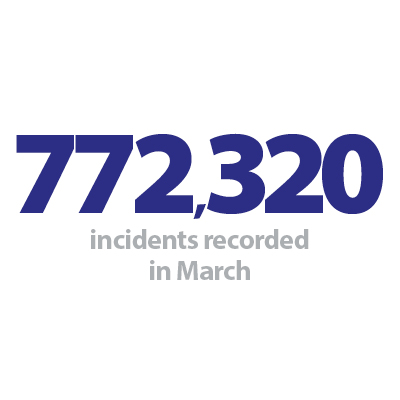
- There were 772,320 incidents in March, which is up by 10.4% on February but remains below the peak seen in December 2024 (806,410).
- There were 79,190 category 1 incidents (life-threatening injuries and illnesses) and 391,850 category 2 incidents, both lower than peaks seen at the end of 2024, but up by 10% each from the previous month.
Response times and handovers
The national ambulance response time targets are seven minutes for category 1 incidents and 18 minutes for category 2 incidents. As part of the plan to recover urgent and emergency care, NHS England adjusted the category 2 target to 30 minutes, on a temporary basis.
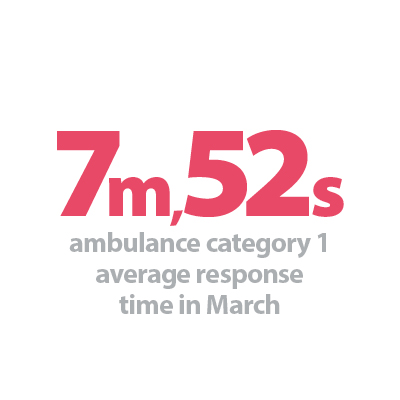
- The average response time across England for category 1 incidents was 7 minutes 52 seconds - the first time it has dropped below eight minutes since June 2021, and the shortest response time recorded since May 2021 (see figure 3). However, this is still some distance from the seven-minute standard.
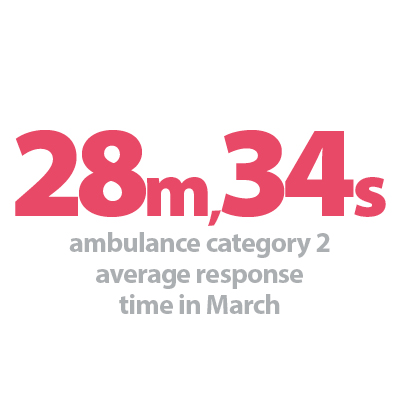
- For category 2 incidents, the average response time was 28 minutes and 34 seconds, meeting the 30-minute recovery target for the third time in four years.
- Two regions, the Northeast and London, met the seven-minute category 1 target this month.
- Nine ambulance services met the 30-minute target for category 2 response times in March.
- In March 2025, there were a total of 408,460 ambulance handovers where the handover time is known, an increase of 11.6% from February. Of these, 67% took over 15 minutes, 28% took over 30 minutes and 9% took over an hour.
Figure 3
Ambulance response times for category 1 incidents
